

Assembly Line Balancing
Generate the most efficient assignment of tasks to operators and stations, quickly, accurately, and visually! Create, Compare, Manage, and Publish multiple scenarios for model-mix and production volume concurrently. Analyze, Visualize, and Report on actual production forecast orders or conceptual model/option mix scenarios.
Proplanner's line balancing module is the heart of the Assembly Planner solution and includes the most features, capabilities and performance of any other Line Balancing application in the market.
Proplanner's line balancing module can quickly balance and visualize thousands of tasks, hundreds of models and options, hundreds of customer orders, and satisfy the largest number of hard and soft constraints including Precedence, Resources, Workzones, Grouping, Ergonomics, Inspection, and Product Orientation.
Designed specifically for the automotive, industrial, and agricultural equipment industries, there is no job too big for Proplanner's line balancing solution!
Data and Document Integration
When tasks are moved in a balance, all associated data moves with it, including required parts and tools, models and options, standard time, value add analysis, images, and other task details.
As you create line balance alternatives, know that you can easily reconcile engineering changes that have occurred since starting your balancing project and then automatically apply your changes to update your process routings.
Mixed Model and Option Intelligence & Analysis
When you're assembling tens to thousands of product variations, it's not enough to only consider a handful when establishing a task assignment line balance that will be used for all.
The Line Balancing module leverages Assembly Planner's process planning structure that makes it easy to identify common tasks as well as tasks that are unique to one or more product models or options. Every chart view and report within line balancing then provides an aggregated and detailed analysis of the varying labor time that each product model and/or option requires.
Not only is the varying labor time for each model or option important to consider, but also the total demand for each model and option configuration. Users can provide demand percentages for each model and option within the timeframe for which they are planning the balance.
Alternatively, users can provide an order file that includes a list of each unit serial number and its model and option definition, from which the demand percentages are automatically calculated. With this information, the weighted average labor time across all units can be considered in addition to the most frequent and worst-case configurations.
Scenario Management and What-If Analysis
Each balance is stored as a scenario. No matter how many changes you make to task assignments, takt time, model and option demand percentages, constraints, etc., you can save an unlimited number of scenarios.
Scenarios can be organized in a flexible folder structure within the software for convenient retrieval, so that each line balance created can be reviewed or used for implementation at a later time.
A direct comparison of one scenario to another is also easy. Since scenarios, which contain detailed Activity (task), Part, Tool, and Station data are stored as XML data sets, they can be easily accessed by external applications and provide for a powerful data sharing capability. Additionally, since scenarios are stored external to the database they are only updated when the engineer chooses to re-synchronize any particular scenario with the database.
Synchronization essentially updates a scenario with any changes to the Activities or Activity Precedence which occurred since it was last created or updated.

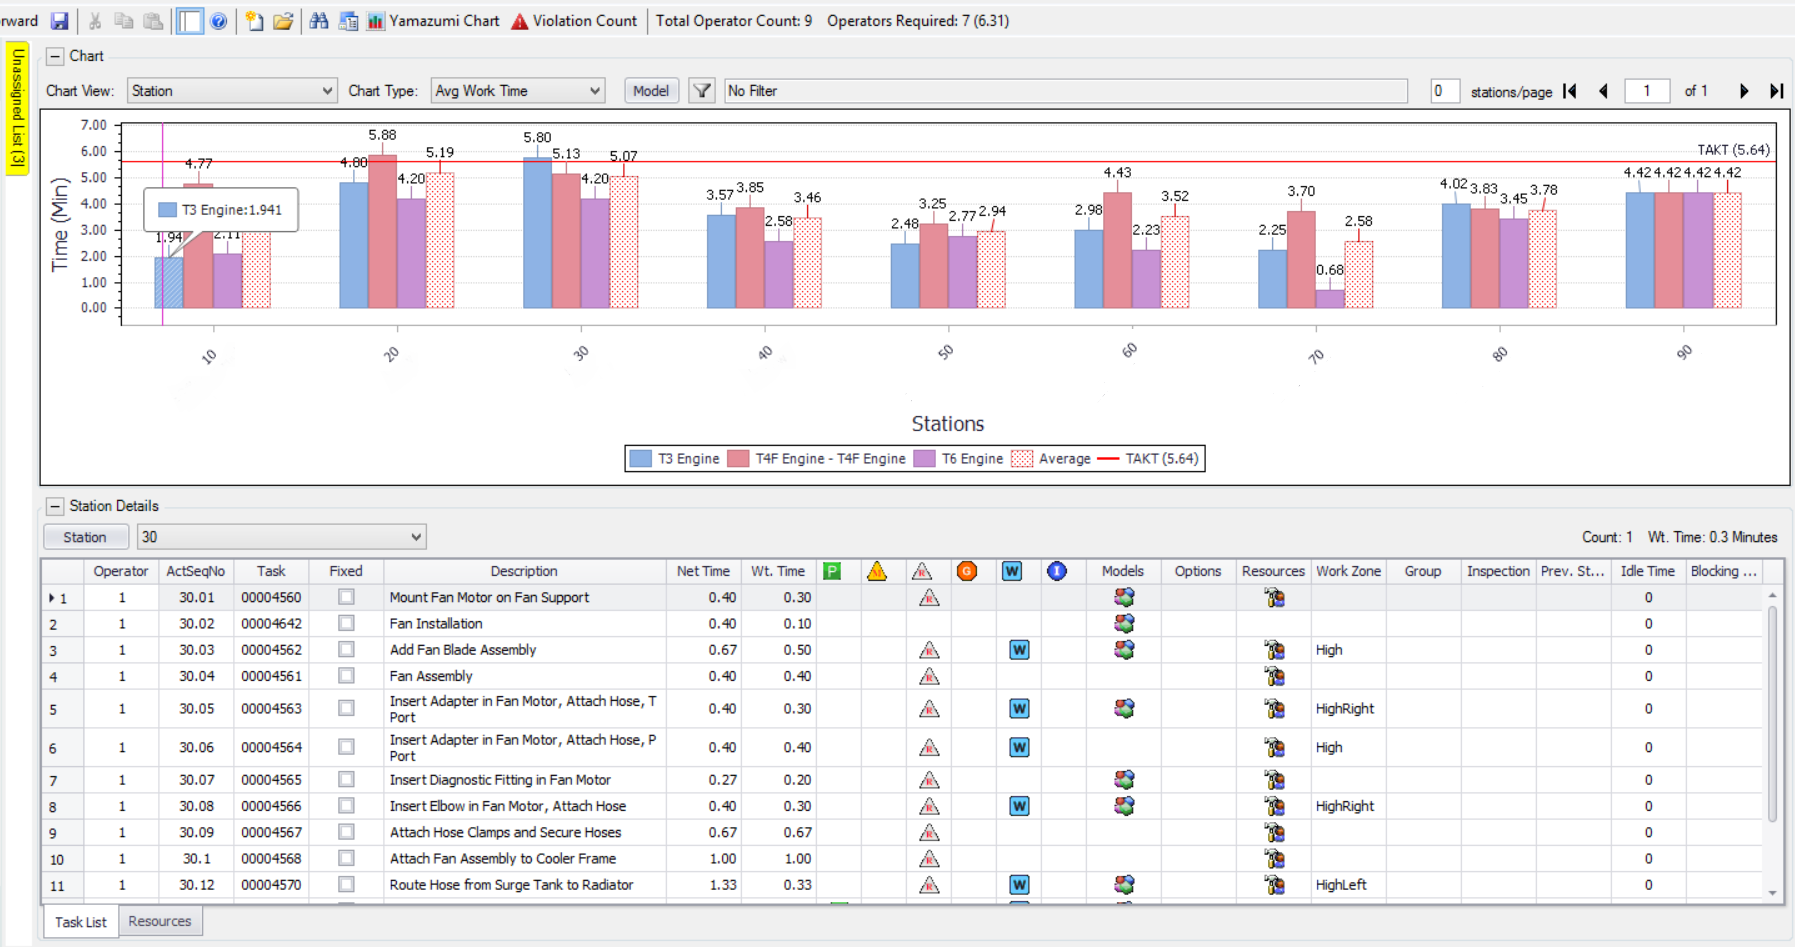
Yamazumi Charts
Let the software generate a mixed model Yamazumi chart that you can not only print and review but actually manipulate and use to reassign tasks as you analyze.
- View and filter by stations, operators, models, and/or options
- Color code by value add analysis, work zones, or task groups
- Drag and drop to reassign tasks
- View embedded task details
- View new operator task videos


3D Virtual Assembly for Task Assignment
View CAD objects while re-balancing the line to get visual confirmation that the process sequence being established is feasible. This brings the product and process engineering teams several steps closer together and helps process engineers anticipate issues with their task assignment by viewing the progression of the assembly in 3D.

Value-add Analysis
Multiple chart views display value add, non-value-add, and required non-value-add content in times and percentages to help identify critical areas for process improvement and waste reduction. This data comes directly from your time studies and master process routings; no extra data entry necessary.

Constraints
Being able to consider physical and other types of constraints that limit your ability to assign tasks along the line is a critical part of effective line balancing. Too often this knowledge remains undocumented and must be re-discussed and re-learned over time.
Once documented, Assembly Planner will warn you of violations to the defined constraints before line balance changes are made.
The types of constraints considered are:
-
Predecessors that must be completed before other tasks can begin. This is the most important type of constraint because it ensures that tasks are assigned in a way that the installation of each part is physically feasible.

-
Monumental tools or equipment that are required by certain tasks but cannot be moved. Documenting this constraint will ensure that each task that requires the use of a monument is assigned to the station in which the monument exists.
-
Work Zones that define which side of the line or area of the unit a task must be performed. This constraint helps ensure that an operator only works in one area of the station and isn't wasting time walking around the unit to complete all tasks.
-
Task Groups that must be performed at the same station or by the same operator. Documenting this constraint is important so that if one task in the group that must be performed together is reassigned, all tasks in that group are reassigned.
-
Inspections or other tasks that cannot be performed at the same station as a corresponding task. This prevents an operator who performs the installation of part from also signing off on the in-line inspection of the installation of that part, for example.
Balancing Algorithms
Manually moving tasks can be quick but don't always lead to the most efficient overall balance. You can use Proplaner's flexible, user-driven, industry-leading balancing algorithms to generate balances that:
-
Minimize takt. You define the number of stations available and the line will be balanced, following all constraints, to find the lowest achievable takt time.
-
Minimize stations. You define the required takt time and the line will be balanced, following all constraints, to use the minimum required stations.
-
Minimize operators. No tasks are moved by this algorithm. Instead, operators are redistributed, to account for frequently fluctuating labor availability.
-
Consider weighted average times vs. peak model times. When balancing to a weighted average, some units will be allowed to exceed takt because others will fall below takt. When balancing to the peak model, the takt time is set so that it is never exceeded.
-
Support parallel operator and shared operator strategies. When a single task exceeds takt time, parallel operators can work on alternating units to keep the line running. Shared operators work in multiple stations to perform their assigned job.

Reporting
View and filter data in tables, charts, and graphical formats to perform detailed analysis and presentations. Reports can be exported to Excel or other reporting applications for further manipulation.
-
Balance Summary reports provide extensive detail on the Efficiency of your line balance whereby the total sum of all operator cycle times is compared to the line TAKT multiplied by all of the operators assigned.
-
Parts and Tools reports provide a detailed list of every part and tool needed at every operator station based upon the aggregation of all parts and tools consumed by the Activities assigned to each operator.
-
Balance Comparison reports provide detailed comparisons between multiple line balance scenarios, such as Activities added or removed for each operator, Parts and Tools added or removed for each operator, as well as cycle time differences by Model.
-
Standard Work Documents are essentially shop floor work instructions that can be published directly to the Shop Floor Viewer or send to PDF files for any particular line balance scenario. This is a powerful capability in that it allows the engineer to generate work instructions without needing to apply any specific scenario back to the database.
Clustered Precedence

Clustered precedence makes it possible to quickly and accurately define and maintain precedence among thousands of Activities. Simply drag your Activities into user-defined clusters or assign cluster names to Activities in the Precedence spreadsheet view. Precedence then can be defined between Activities within the clusters and between both Clusters and Activities not assigned to a cluster.
Clusters can even be defined within clusters to provide an infinite amount of precedence flexibility. Engineers can even assign their names and colors to clusters. Blog Here


Drift Analysis

The Drift Analysis feature is included within the Sequence Planner module but relies heavily on data from an applied Line Balancing scenario. Blog Here
Drift Analysis allows the engineer to evaluate the impacts of temporary over-Takt cycle time work conditions on mixed-model production assembly lines with fixed TAKT times during portions of the day.
Many mixed production assembly lines can experience significant fluctuations in station cycle time based upon the specific work content required for each configuration (a variant of model and options) of a product being produced.
In order to maximize productivity, those companies often select a line rate (Takt Time) which is less than the peak cycle time of their highest work content product. Alternatively, some companies struggle with product quality or cycle time repeatability issues which also create cycle times in stations that exceed the line Takt.

Proplanner's powerful Drift Analysis capability allows the engineer to select a range of actual production orders which can then be evaluated in both the Drift and Gantt chart views as well as in an automatically generated data-set table that can be easily copied and pasted into Excel. Start, End, and Break times can be specified for each day of the month and many days can be evaluated concurrently.
Given the large data set sizes commonly encountered, Proplanner's user interface supports un-docking windows which can be placed in different display monitors. Users can also zoom, pan, and filter any of the display views.

Why do you only consider a handful of product variations when determining a line balance today?
It's very difficult to maintain, let alone analyze, data at the level of detail necessary for accurate mixed model line balancing without a tool that's specifically designed for the task. Proplanner provides that tool. When you only consider your top runners, a lot of opportunities are left on the line. Proplanner will calculate the work content for every model, every option, and every combination.
How do you identify and implement changes?
Moving a task in an Excel file is easy. Determining and communicating the part delivery and tool location changes, as well as work instruction refinement and deployment that follow a task reassignment, is more challenging and time-consuming.
Do you know what the impact on each operator will be when your model mix changes?
Whether your production plan continuously changes due to a stream of custom orders or your model mix changes a few times a year, it's not easy to understand the impact such changes will have or to be able to compare different alternatives in preparation for those changes.
Assembly Planner's Line Balancing brings flexibility to line re-balancing:
-
Task and time details are maintained in the process library and used for line balance planning. Changes can be easily transferred back and forth.
-
Drag & drop functionality makes it easy to move tasks and assess the change quickly.
-
You choose the models, options, stations, and operators to analyze. You decide which constraints to consider.
-
Many chart formats are available to view and present the balance that's most relatable to your team.
-
You can manually reassign tasks or review alternatives that the balancing algorithms provide for new ideas.
-
If any variable changes, see the impact on the balance immediately.
How much time do you spend creating Yamazumi charts?
Electronic, automatically updated charts are an efficient alternative to charts made out of magnet boards or Post-It notes.
How much time does it take to update work instructions after you re-balance tasks?
Work instructions are typically standalone documents that are disconnected from other process routing data, which means they have to be updated after line balancing and other change decisions are made, often by a different team or person.
How do you know whether moving a task to a new station or operator is allowed and feasible?
Physical, assembly, and other types of constraints that restrict where certain tasks can be performed are often undocumented knowledge that results in numerous extended email strings, meetings, or implementation mistakes.
Proplanner provides a single system for engineers to create a plan for manufacturing. We suggest you review these solutions next:
Line balance scenarios can be merged with order details to perform advanced scheduling and operator allocation
New work instructions are generated automatically when new line balances are developed
Parts can be mapped directly from the BOM to tasks in the routing
Parts mapped to tasks can update logistics planning (PFEP)